
Fund Price & Performance
| Date | ICIVF NAV (without distribution) | ICIVF NAV (with distribution) | MSCI ACWI | ASX200 |
|---|---|---|---|---|
| 30 June 2026 | A$1.0585 (Ex-distribution NAV) | A$2.1301 | 1617.2911 points | 8778.7000 points |
| 31 May 2026 | A$1.0268 | A$2.0186 | 1571.5730 points | 8731.7000 points |
| 30 Apr 2026 | A$0.9329 | A$1.8340 | 1498.1594 points | 8665.8000 points |
| 31 Mar 2026 | A$0.7741 | A$1.5218 | 1429.3253 points | 8481.8000 points |
| 28 Feb 2026 | A$0.8585 | A$1.6878 | 1482.8632 points | 9198.6000 points |
| 31 Jan 2026 | A$0.8361 | A$1.6437 | 1490.6246 points | 8869.1000 points |
NOTE:
ICIVF = The i Capital International Value Fund
MSCI ACWI Index: A free float-adjusted market capitalization weighted index which consists of 48 country indices, comprising 23 developed and 25 emerging market country indices.
Total % Change
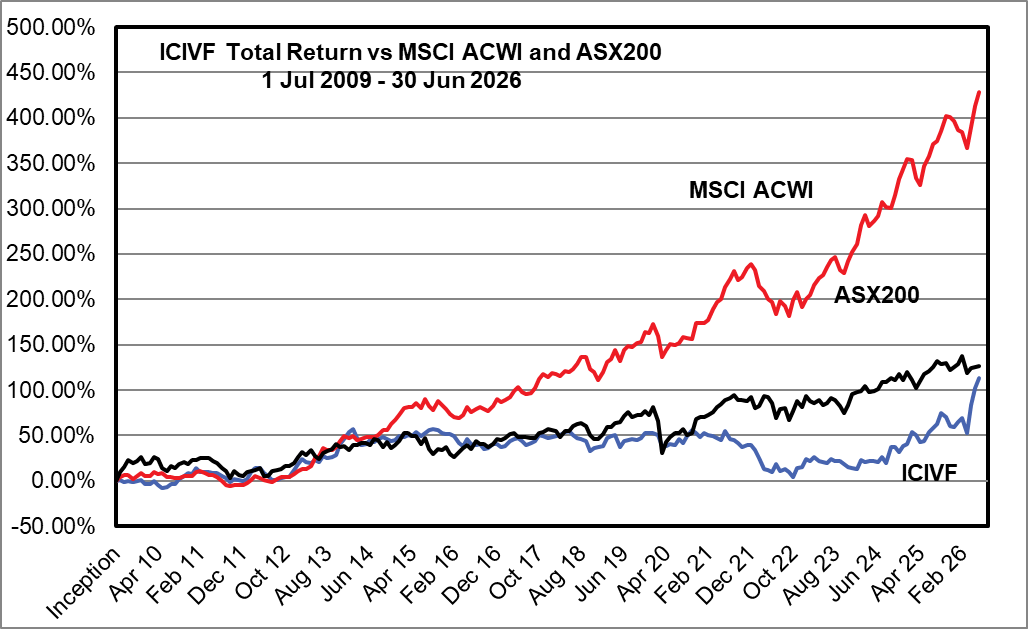
| 1 Jul 2009 | 30 Jun 2026 | % Change | Compound Return | |
|---|---|---|---|---|
| ICIVF | A$1.0000 | A$2.1301 | 113.01% | 4.55% |
| MSCI ACWI | 306.1537 points | 1617.2911 points | 428.26% | 10.28% |
| ASX200 | 3874.0000 points | 8778.7000 points | 126.61% | 4.93% |
| Date | ICIVF NAV (without distribution) | ICIVF NAV (with distribution) | MSCI ACWI | ASX200 |
|---|---|---|---|---|
| 31 Dec 2025 | A$0.8076 | A$1.5877 | 1521.5185 points | 8714.3000 points |
| 30 Nov 2025 | A$0.8141 | A$1.6005 | 1532.6962 points | 8614.1000 points |
| 31 Oct 2025 | A$0.8670 | A$1.7045 | 1537.0945 points | 8881.9000 points |
| 30 Sept 2025 | A$0.8856 | A$1.7410 | 1485.8970 points | 8848.8000 points |
| 31 Aug 2025 | A$0.8289 | A$1.6296 | 1453.8800 points | 8973.1000 points |
| 31 July 2025 | A$0.8043 | A$1.5812 | 1443.8485 points | 8742.8000 points |
| 30 June 2025 | A$0.7794 (Ex-distribution NAV) | A$1.5322 | 1400.6129 points | 8542.3000 points |
| 31 May 2025 | A$0.7546 | A$1.4374 | 1366.6312 points | 8434.7000 points |
| 30 Apr 2025 | A$0.7482 | A$1.4252 | 1302.7115 points | 8126.2000 points |
| 31 Mar 2025 | A$0.7873 | A$1.4997 | 1327.3769 points | 7843.4000 points |
| 28 Feb 2025 | A$0.8077 | A$1.5385 | 1387.7082 points | 8172.4000 points |
| 31 Jan 2025 | A$0.7360 | A$1.4020 | 1393.2540 points | 8532.3000 points |
NOTE:
ICIVF = The i Capital International Value Fund
MSCI ACWI Index: A free float-adjusted market capitalization weighted index which consists of 48 country indices, comprising 23 developed and 25 emerging market country indices.
Total % Change
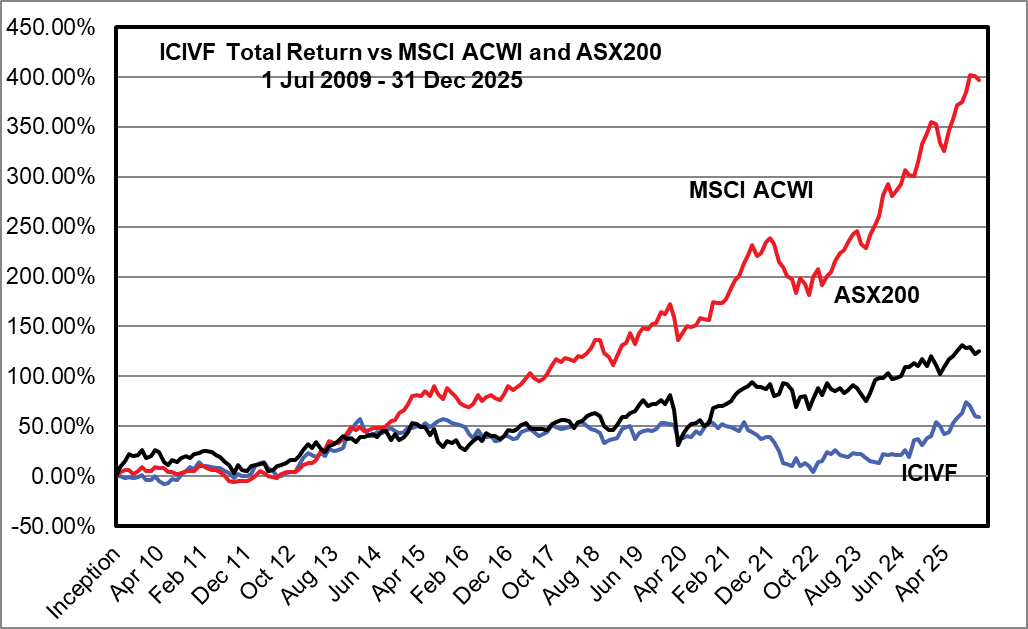
| 1 Jul 2009 | 31 Dec 2025 | % Change | Compound Return | |
|---|---|---|---|---|
| ICIVF | A$1.0000 | A$1.5887 | 58.77% | 2.84% |
| MSCI ACWI | 306.1537 points | 1521.5185 points | 396.98% | 10.20% |
| ASX200 | 3874.0000 points | 8714.3000 points | 124.94% | 5.03% |
| Date | ICIVF NAV (without distribution) | ICIVF NAV (with distribution) | MSCI ACWI | ASX200 |
|---|---|---|---|---|
| 31 Dec 2024 | A$0.7275 | A$1.3858 | 1358.8520 points | 8159.1000 points |
| 30 Nov 2024 | A$0.6912 | A$1.3166 | 1323.9550 points | 8436.2000 points |
| 31 Oct 2024 | A$0.7178 | A$1.3673 | 1270.6940 points | 8160.0000 points |
| 30 Sep 2024 | A$0.7171 | A$1.3660 | 1227.7900 points | 8269.8000 points |
| 31 Aug 2024 | A$0.6253 | A$1.1911 | 1228.7100 points | 8091.9000 points |
| 31 Jul 2024 | A$0.6600 | A$1.2572 | 1246.7800 points | 8092.3000 points |
| 30 Jun 2024 | A$0.6337 (Ex-distribution NAV) | A$1.2071 | 1200.8800 points | 7767.5000 points |
| 31 May 2024 | A$0.6623 | A$1.2137 | 1181.1700 points | 7701.7000 points |
| 30 Apr 2024 | A$0.6654 | A$1.2194 | 1165.1700 points | 7664.1000 points |
| 31 Mar 2024 | A$0.6588 | A$1.2073 | 1201.0700 points | 7896.9000 points |
| 29 Feb 2024 | A$0.6682 | A$1.2245 | 1169.1300 points | 7698.7000 points |
| 31 Jan 2024 | A$0.6154 | A$1.1277 | 1105.5600 points | 7680.7000 points |
NOTE:
ICIVF = The i Capital International Value Fund
MSCI ACWI Index: A free float-adjusted market capitalization weighted index which consists of 48 country indices, comprising 23 developed and 25 emerging market country indices.
Total % Change
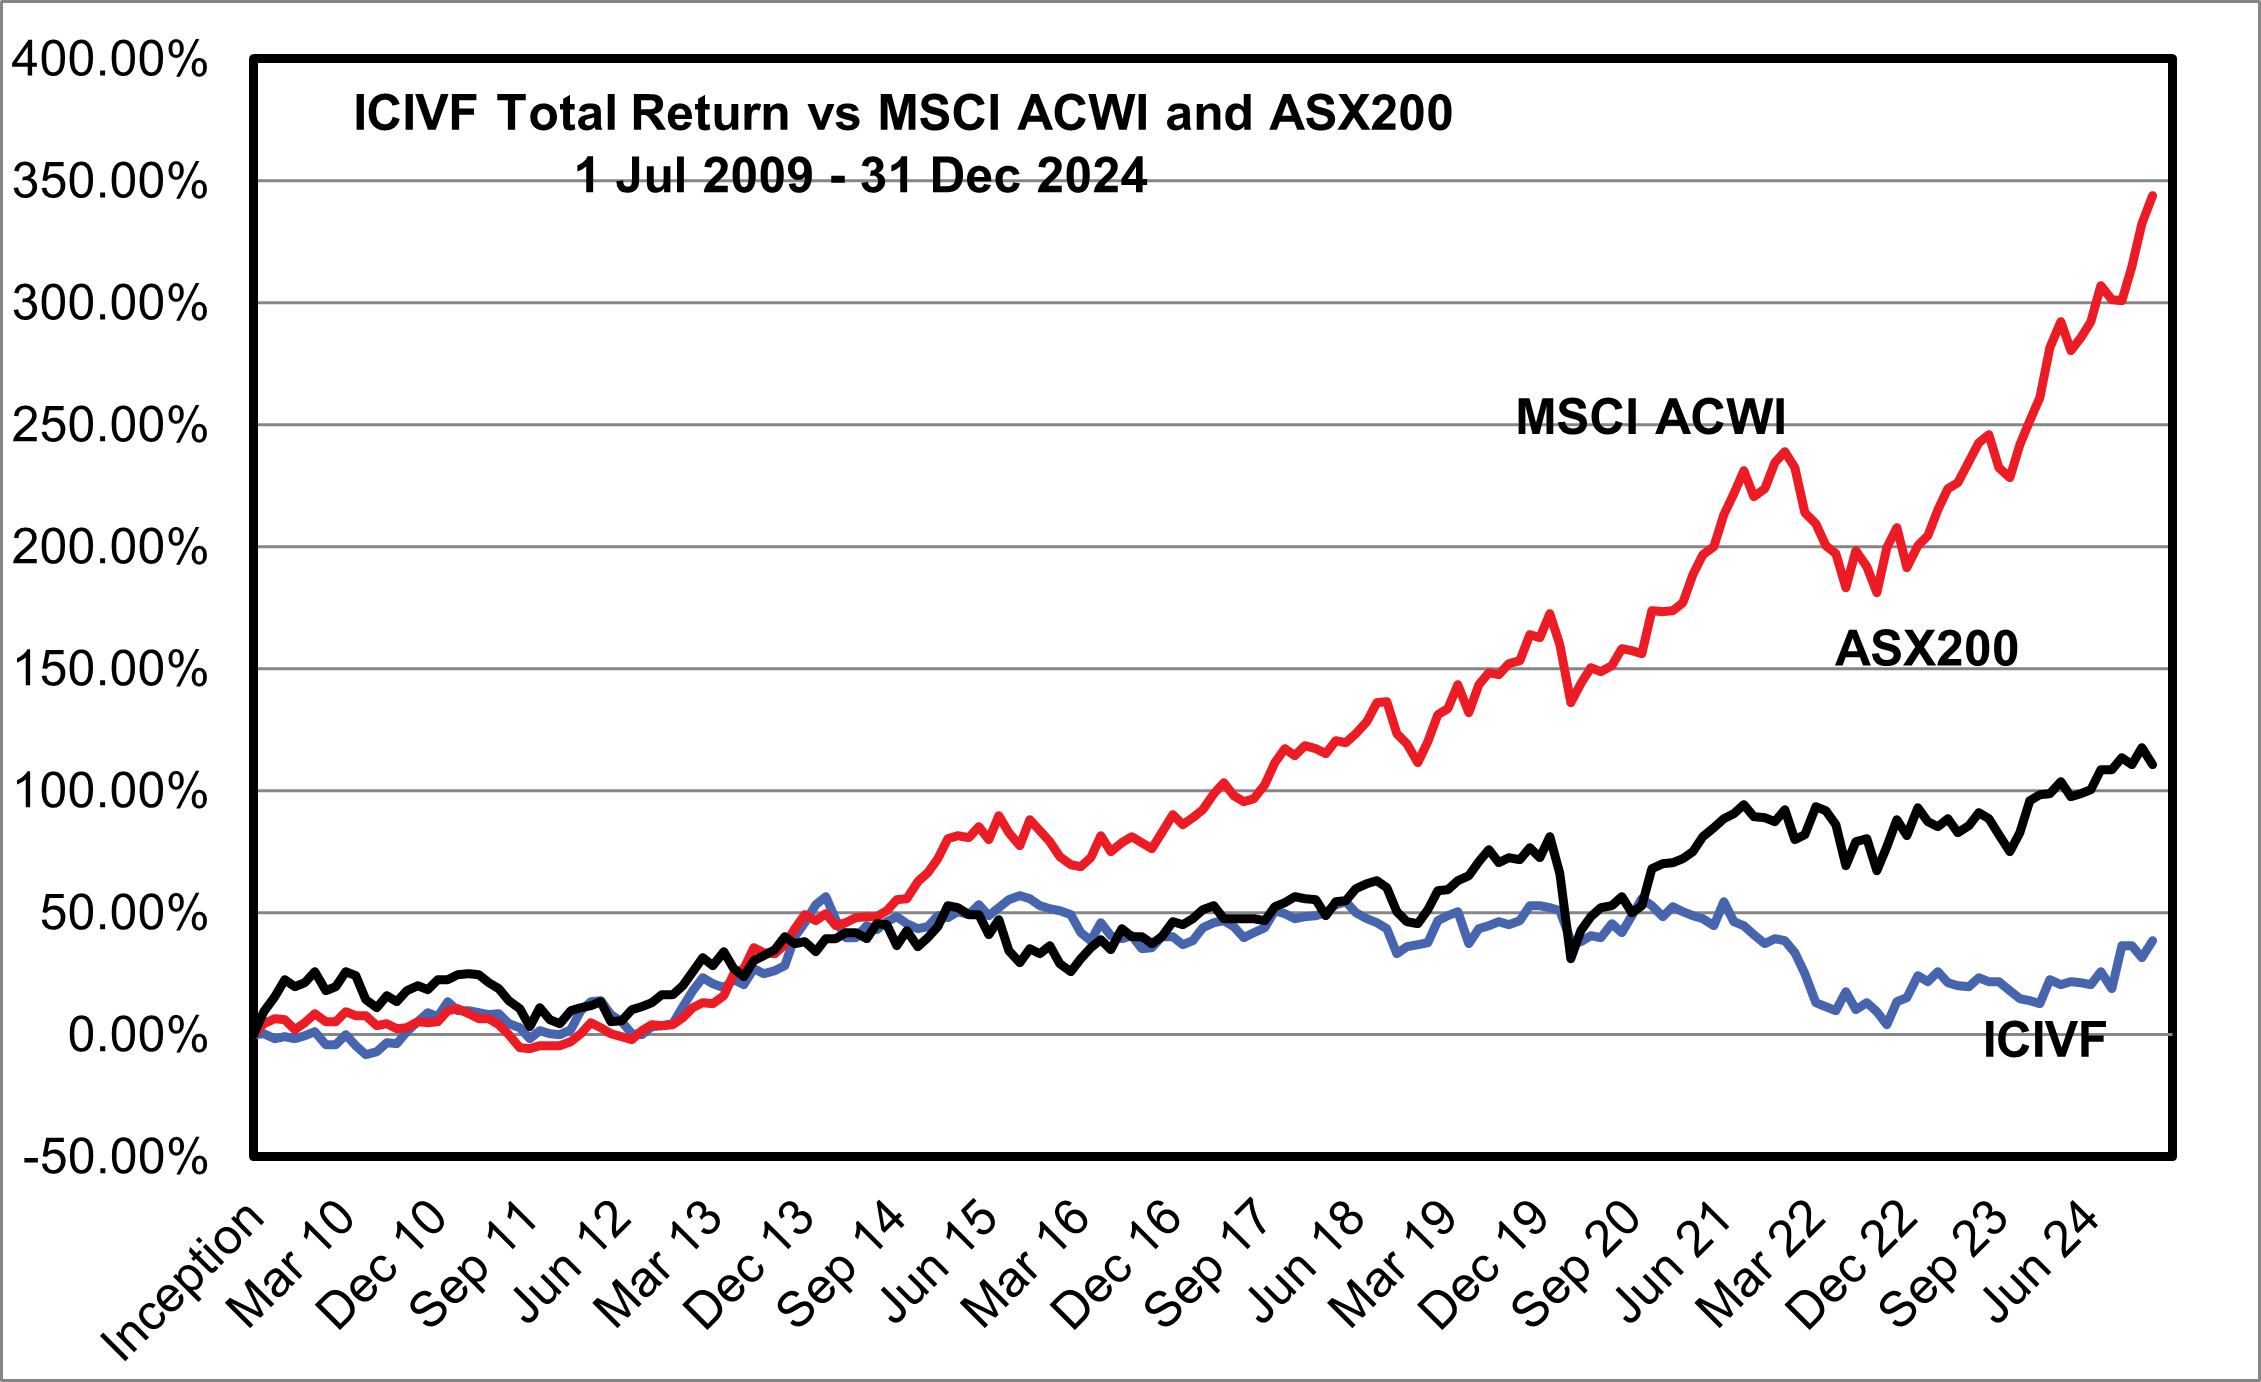
| 1 Jul 2009 | 31 Dec 2024 | % Change | Compound Return | |
|---|---|---|---|---|
| ICIVF | A$1.0000 | A$1.3858 | 38.58% | 2.13% |
| MSCI ACWI | 306.1537 points | 1358.8520 points | 343.85% | 10.08% |
| ASX200 | 3874.0000 points | 8159.1000 points | 110.61% | 4.92% |
| Date | ICIVF NAV (without distribution) | ICIVF NAV (with distribution) | MSCI ACWI | ASX200 |
|---|---|---|---|---|
| 31 Dec 2023 | A$0.6232 | A$1.1420 | 1077.1700 points | 7590.8000 points |
| 30 Nov 2023 | A$0.6266 | A$1.1483 | 1047.2500 points | 7087.3000 points |
| 31 Oct 2023 | A$0.6434 | A$1.1791 | 1005.5329 points | 6780.7000 points |
| 30 Sep 2023 | A$0.6651 | A$1.2188 | 1017.6966 points | 7048.6000 points |
| 31 Aug 2023 | A$0.6655 | A$1.2196 | 1059.4430 points | 7305.3000 points |
| 31 Jul 2023 | A$0.6733 | A$1.2338 | 1049.3570 points | 7410.4000 points |
| 30 Jun 2023 | A$0.6529 (Ex-distribution NAV) | A$1.1965 | 1025.8252 points | 7203.3000 points |
| 31 May 2023 | A$0.6799 | A$1.2004 | 998.8045 points | 7091.3000 points |
| 30 Apr 2023 | A$0.6877 | A$1.2142 | 991.1400 points | 7309.2000 points |
| 31 Mar 2023 | A$0.7216 | A$1.2581 | 965.6700 points | 7177.8000 points |
| 28 Feb 2023 | A$0.6903 | A$1.2188 | 932.7844 points | 7258.4000 points |
| 31 Jan 2023 | A$0.7040 | A$1.2429 | 920.1207 points | 7476.7000 points |
NOTE:
ICIVF = The i Capital International Value Fund
MSCI ACWI Index: A free float-adjusted market capitalization weighted index which consists of 48 country indices, comprising 23 developed and 25 emerging market country indices.
Total % Change
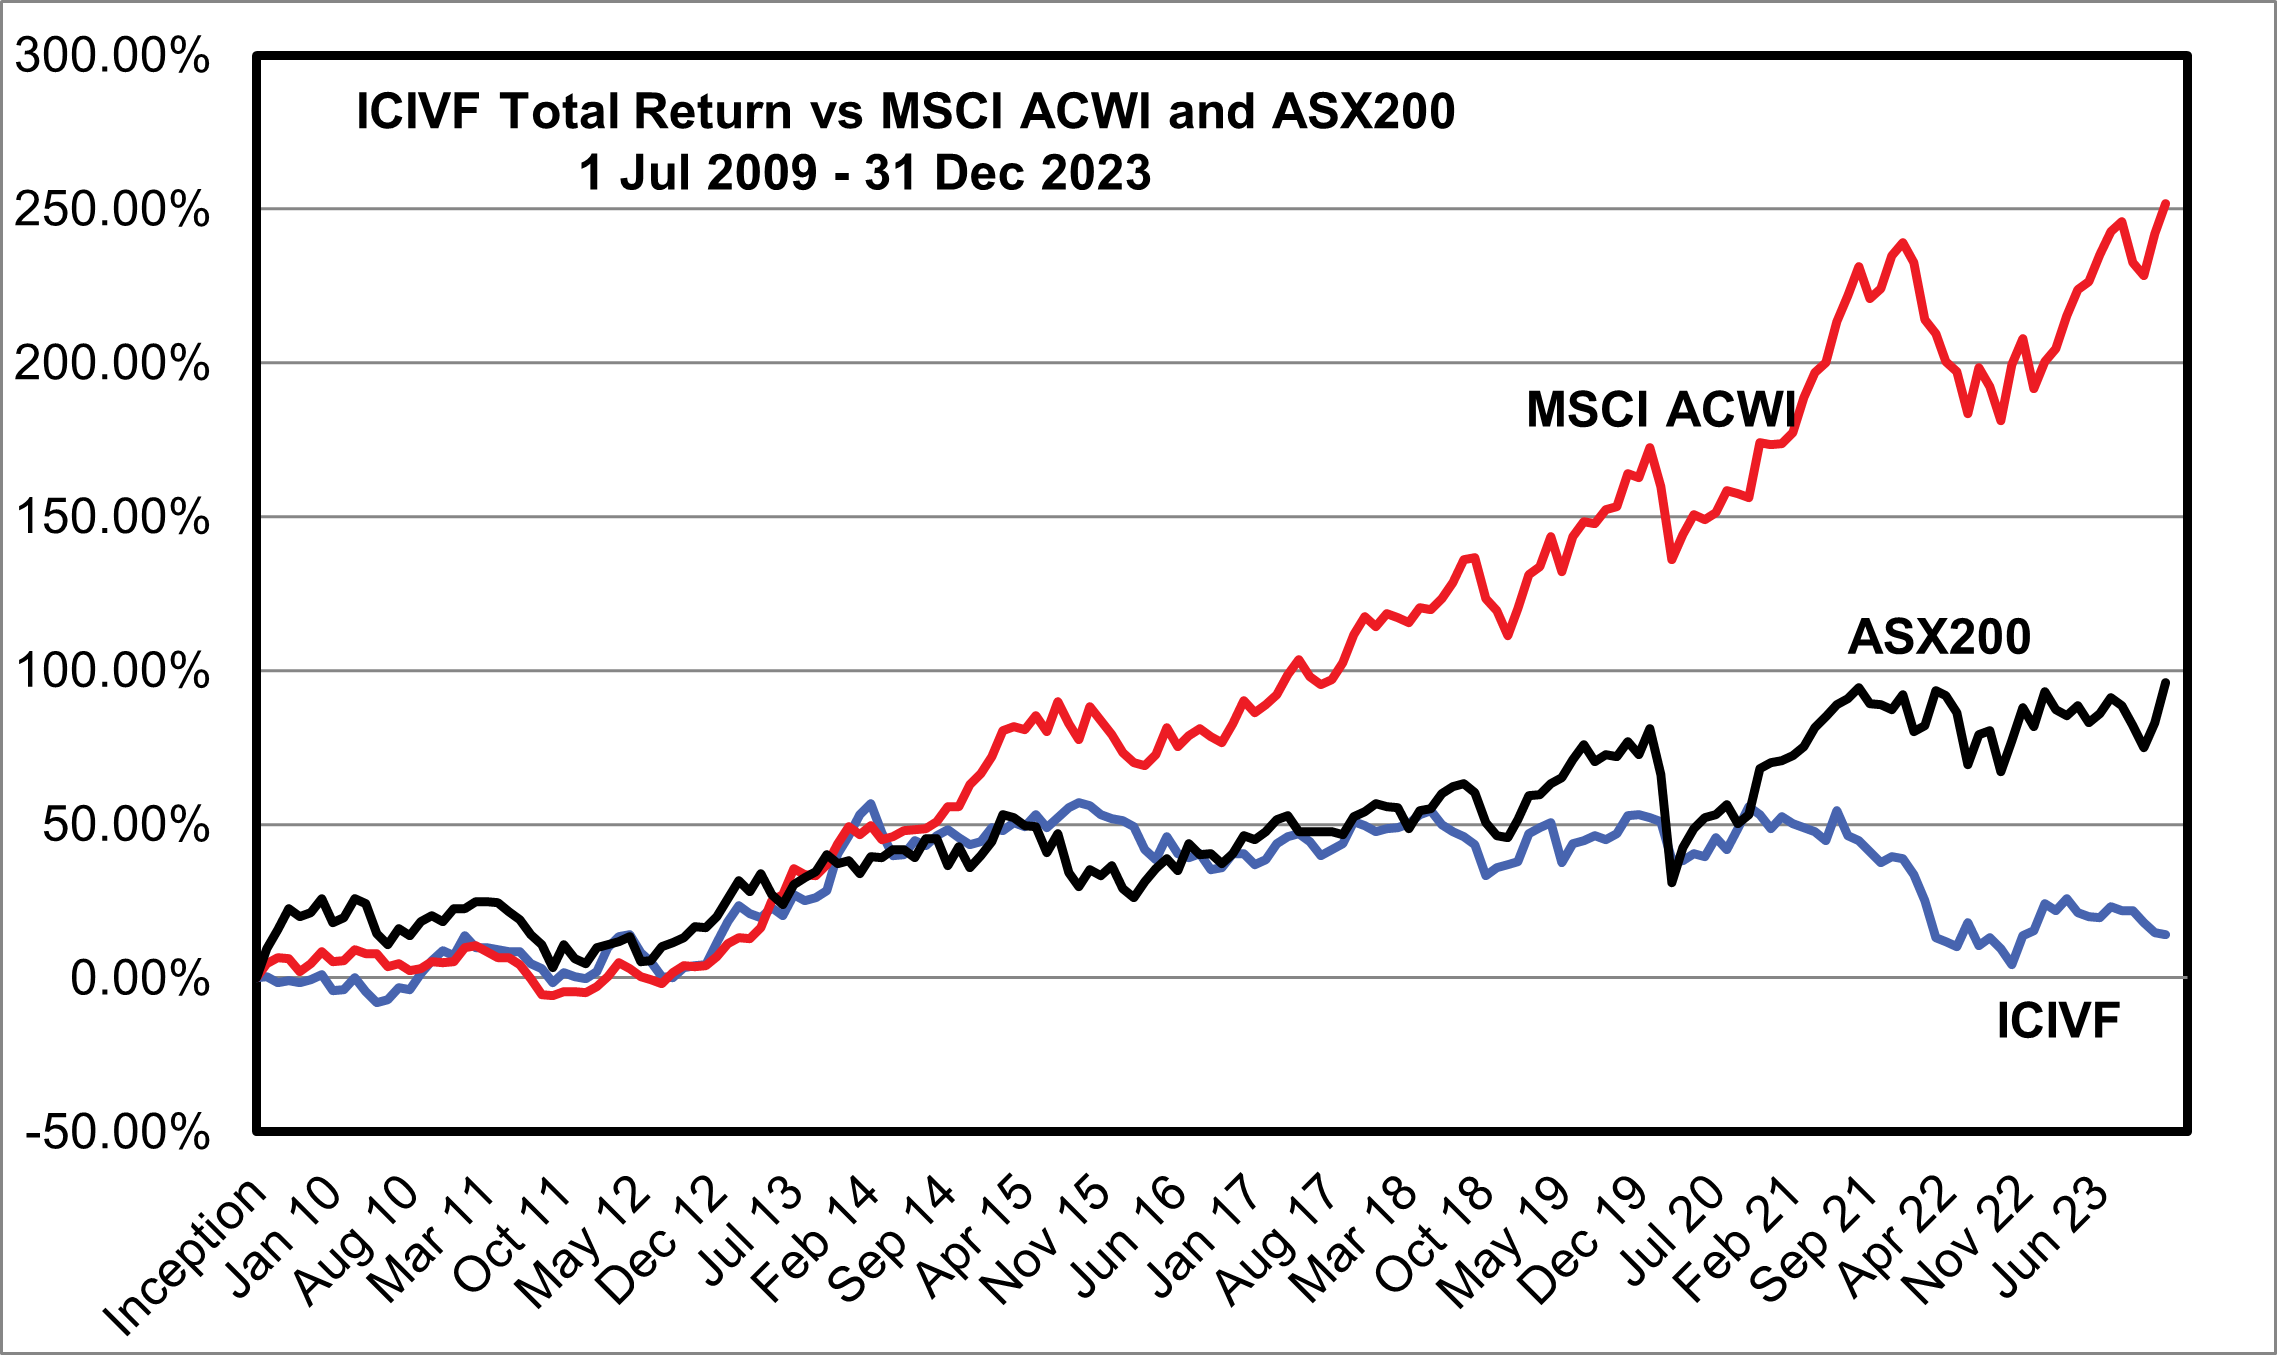
| 1 Jul 2009 | 31 Dec 2023 | % Change | Compound Return | |
|---|---|---|---|---|
| ICIVF | A$1.0000 | A$1.1420 | 14.20% | 0.92% |
| MSCI ACWI | 306.1537 points | 1077.1700 points | 251.84% | 9.06% |
| ASX200 | 3874.0000 points | 7590.8000 points | 95.94% | 4.75% |
| Date | ICIVF NAV (without distribution) | ICIVF NAV (with distribution) | MSCI ACWI | ASX200 |
|---|---|---|---|---|
| 31 Dec 2022 | A$0.6535 | A$1.1538 | 892.6962 points | 7038.7000 points |
| 30 Nov 2022 | A$0.6442 | A$1.1374 | 942.0930 points | 7284.2000 points |
| 31 Oct 2022 | A$0.5905 | A$1.0425 | 916.9951 points | 6863.5000 points |
| 30 Sep 2022 | A$0.6213 | A$1.0969 | 860.6745 points | 6474.2000 points |
| 31 Aug 2022 | A$0.6405 | A$1.1308 | 894.3269 points | 6986.8000 points |
| 31 Jul 2022 | A$0.6258 | A$1.1049 | 913.8994 points | 6945.2000 points |
| 30 Jun 2022 | A$0.6678 (Ex-distribution NAV) | A$1.1790 | 867.8466 points | 6568.1000 points |
| 31 May 2022 | A$0.6420 | A$1.1006 | 910.0357 points | 7211.2000 points |
| 30 Apr 2022 | A$0.6517 | A$1.1172 | 919.8100 points | 7435.0000 points |
| 31 Mar 2022 | A$0.6605 | A$1.1323 | 947.5462 points | 7499.6000 points |
| 28 Feb 2022 | A$0.7296 | A$1.2508 | 961.9204 points | 7049.1000 points |
| 31 Jan 2022 | A$0.7803 | A$1.3377 | 1018.2062 points | 6971.6000 points |
NOTE:
ICIVF = The i Capital International Value Fund
MSCI ACWI Index: A free float-adjusted market capitalization weighted index which consists of 48 country indices, comprising 23 developed and 25 emerging market country indices.
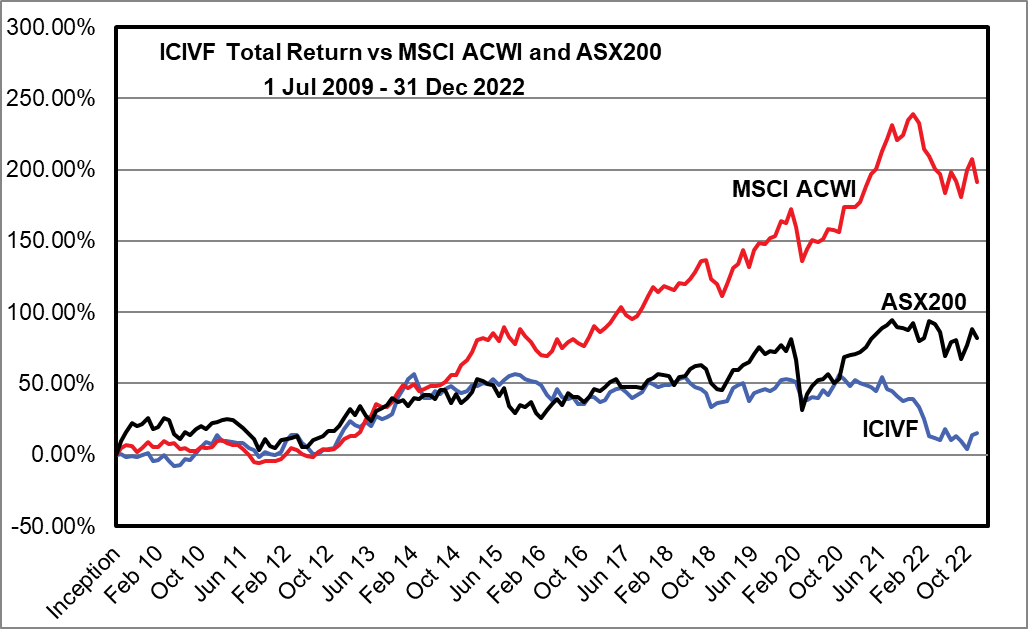
Total % Change
| 1 Jul 2009 | 31 Dec 2022 | % Change | Compound Return | |
|---|---|---|---|---|
| ICIVF | A$1.0000 | A$1.1538 | 15.38% | 1.06% |
| MSCI ACWI | 306.1537 points | 892.6962 points | 191.58% | 8.24% |
| ASX200 | 3874.0000 points | 7038.7000 points | 81.69% | 4.52% |
| Date | ICIVF NAV (without distribution) | ICIVF NAV (with distribution) | MSCI ACWI | ASX200 |
|---|---|---|---|---|
| 31 Dec 2021 | A$0.8095 | A$1.3878 | 1038.2055 points | 7444.6000 points |
| 30 Nov 2021 | A$0.8129 | A$1.3936 | 1024.6571 points | 7256.0000 points |
| 31 Oct 2021 | A$0.8019 | A$1.3747 | 992.1829 points | 7323.7000 points |
| 30 Sep 2021 | A$0.8238 | A$1.4123 | 982.2271 points | 7332.2000 points |
| 31 Aug 2021 | A$0.8439 | A$1.4467 | 1014.2588 points | 7534.9000 points |
| 31 July 2021 | A$0.8533 | A$1.4629 | 985.2501 points | 7392.6000 points |
| 30 Jun 2021 | A$0.9011 (Ex-distribution NAV) | A$1.5448 | 959.0013 points | 7313.0000 points |
| 31 May 2021 | A$0.8753 | A$1.4475 | 919.1293 points | 7161.6000 points |
| 30 Apr 2021 | A$0.8917 | A$1.4746 | 908.5891 points | 7025.8000 points |
| 31 Mar 2021 | A$0.9009 | A$1.4898 | 883.9594 points | 6790.7000 points |
| 28 Feb 2021 | A$0.9090 | A$1.5032 | 848.8357 points | 6673.3000 points |
| 31 Jan 2021 | A$0.9218 | A$1.5243 | 837.9392 points | 6607.4000 points |
NOTE:
ICIVF = The i Capital International Value Fund
MSCI ACWI Index: A free float-adjusted market capitalization weighted index which consists of 48 country indices, comprising 23 developed and 25 emerging market country indices.
Total % Change
| 1 Jul 2009 | 31 Dec 2021 | % Change | Compound Return | |
|---|---|---|---|---|
| ICIVF | A$1.0000 | A$1.3878 | 38.78% | 2.65% |
| MSCI ACWI | 306.1537 points | 1038.2055 points | 239.11% | 10.25% |
| ASX200 | 3874.0000 points | 7444.6000 points | 92.17% | 5.36% |

| Date | ICIVF NAV (without distribution) | ICIVF NAV (with distribution) | MSCI ACWI | ASX200 |
|---|---|---|---|---|
| 31 Dec 2020 | A$0.8978 | A$1.4847 | 837.5116 points | 6587.1000 points |
| 30 Nov 2020 | A$0.9257 | A$1.5308 | 839.0673 points | 6517.8000 points |
| 31 Oct 2020 | A$0.9414 | A$1.5568 | 784.6113 points | 5927.6000 points |
| 30 Sep 2020 | A$0.8994 | A$1.4873 | 788.4888 points | 5815.9000 points |
| 31 Aug 2020 | A$0.8576 | A$1.4182 | 790.8355 points | 6060.5000 points |
| 31 Jul 2020 | A$0.8809 | A$1.4567 | 769.5665 points | 5927.8000 points |
| 30 Jun 2020 | A$0.8444 | A$1.3964 | 762.3921 points | 5897.9000 points |
| 31 May 2020 | A$0.8500 | A$1.4056 | 767.5063 points | 5755.7000 points |
| 30 Apr 2020 | A$0.8357 | A$1.3820 | 747.1665 points | 5522.4000 points |
| 31 Mar 2020 | A$0.8384 | A$1.3864 | 722.7270 points | 5076.8000 points |
| 29 Feb 2020 | A$0.9119 | A$1.5080 | 795.2809 points | 6441.2000 points |
| 31 Jan 2020 | A$0.9206 | A$1.5224 | 834.4457 points | 7017.2000 points |
NOTE:
ICIVF = The i Capital International Value Fund
MSCI ACWI Index: A free float-adjusted market capitalization weighted index which consists of 48 country indices, comprising 23 developed and 25 emerging market country indices.
Total % Change
| 1 Jul 2009 | 31 Dec 2020 | % Change | Compound Return | |
|---|---|---|---|---|
| ICIVF | A$1.0000 | A$1.4847 | 48.47% | 3.49% |
| MSCI ACWI | 306.1537 points | 837.5116 points | 173.56% | 9.14% |
| ASX200 | 3874.0000 points | 6587.1000 points | 70.03% | 4.72% |

| Date | ICIVF NAV (without distribution) | ICIVF NAV (with distribution) | MSCI ACWI | ASX200 |
|---|---|---|---|---|
| 31 Dec 2019 | A$0.9258 | A$1.5310 | 804.1048 points | 6684.1000 points |
| 30 Nov 2019 | A$0.9238 | A$1.5277 | 808.2448 points | 6846.0000 points |
| 31 Oct 2019 | A$0.8880 | A$1.4685 | 775.6868 points | 6663.4000 points |
| 30 Sep 2019 | A$0.8770 | A$1.4503 | 771.9640 points | 6688.3000 points |
| 31 Aug 2019 | A$0.8850 | A$1.4635 | 758.2589 points | 6604.2000 points |
| 31 Jul 2019 | A$0.8757 | A$1.4481 | 760.7531 points | 6812.6000 points |
| 30 Jun 2019 | A$0.8685 (Ex-distribution NAV) | A$1.4362 | 745.9100 points | 6618.8000 points |
| 31 May 2019 | A$0.8716 | A$1.3751 | 710.2745 points | 6396.9000 points |
| 30 Apr 2019 | A$0.9539 | A$1.5050 | 745.6773 points | 6325.5000 points |
| 31 Mar 2019 | A$0.9431 | A$1.4880 | 715.9135 points | 6180.7000 points |
| 28 Feb 2019 | A$0.9313 | A$1.4693 | 707.6828 points | 6169.0000 points |
| 31 Jan 2019 | A$0.8739 | A$1.3788 | 673.6529 points | 5864.7000 points |
NOTE:
ICIVF = The i Capital International Value Fund
MSCI ACWI Index: A free float-adjusted market capitalization weighted index which consists of 48 country indices, comprising 23 developed and 25 emerging market country indices.
Total % Change
| 1 Jul 2009 | 31 Dec 2019 | % Change | Compound Return | |
|---|---|---|---|---|
| ICIVF | A$1.0000 | A$1.5310 | 53.10% | 4.14% |
| MSCI ACWI | 306.1537 points | 804.1048 points | 162.65% | 9.63% |
| ASX200 | 3874.0000 points | 6684.1000 points | 72.54% | 5.33% |

| Date | ICIVF NAV (without distribution) | ICIVF NAV (with distribution) | MSCI ACWI | ASX200 |
|---|---|---|---|---|
| 31 Dec 2018 | A$0.8679 | A$1.3693 | 647.2365 points | 5646.0000 points |
| 30 Nov 2018 | A$0.8618 | A$1.3597 | 672.1746 points | 5667.2000 points |
| 31 Oct 2018 | A$0.8444 | A$1.3322 | 683.6957 points | 5830.3000 points |
| 30 Sep 2018 | A$0.9088 | A$1.4338 | 724.5543 points | 6207.6000 points |
| 31 Aug 2018 | A$0.9253 | A$1.4599 | 723.0084 points | 6319.5000 points |
| 31 Jul 2018 | A$0.9346 | A$1.4745 | 699.2435 points | 6280.2000 points |
| 30 Jun 2018 | A$ 0.9508 (Ex-distribution NAV) | A$1.5001 | 683.7602 points | 6194.6000 points |
| 31 May 2018 | A$ 1.0184 | A$ 1.5445 | 672.3992 points | 6011.9000 points |
| 30 Apr 2018 | A$ 1.0105 | A$ 1.5326 | 675.2273 points | 5982.7000 points |
| 31 Mar 2018 | A$ 0.9908 | A$ 1.5027 | 659.4218 points | 5759.4000 points |
| 28 Feb 2018 | A$ 0.9820 | A$ 1.4893 | 664.8455 points | 6016.0000 points |
| 31 Jan 2018 | A$ 0.9800 | A$ 1.4863 | 668.939 points | 6037.7000 points |
NOTE:
ICIVF = The i Capital International Value Fund
MSCI ACWI Index: A free float-adjusted market capitalization weighted index which consists of 48 country indices, comprising 23 developed and 25 emerging market country indices.
Total % Change
| 1 Jul 2009 | 31 Dec 2018 | % Change | Compound Return | |
|---|---|---|---|---|
| ICIVF | A$1.0000 | A$1.3693 | 36.93% | 3.36% |
| MSCI ACWI | 306.1537 points | 647.2365 points | 111.41% | 8.19% |
| ASX200 | 3874.0000 points | 5646.0000 points | 45.74% | 4.04% |

| Date | ICIVF NAV (without distribution) | ICIVF NAV (with distribution) | MSCI ACWI | ASX200 |
|---|---|---|---|---|
| 31 Dec 2017 | A$ 0.9729 | A$1.4755 | 655.9191 points | 6065.1000 points |
| 30 Nov 2017 | A$ 0.9870 | A$1.4969 | 665.7985 points | 5969.9000 points |
| 31 Oct 2017 | A$ 0.9940 | A$1.5075 | 647.7032 points | 5909.0000 points |
| 30 Sep 2017 | A$ 0.9483 | A$1.4382 | 620.5029 points | 5681.6000 points |
| 31 Aug 2017 | A$0.9351 | A$1.4182 | 603.1742 points | 5714.5000 points |
| 31 Jul 2017 | A$0.9222 | A$1.3986 | 598.2109 points | 5720.0000 points |
| 30 Jun 2017 | A$0.9509 (Ex-distribution NAV) | A$1.4422 | 606.3352 points | 5721.0000 points |
| 31 May 2017 | A$1.0243 | A$1.4700 | 623.0005 points | 5724.0000 points |
| 30 Apr 2017 | A$1.0162 | A$1.4584 | 608.6436 points | 5924.0600 points |
| 31 Mar 2017 | A$1.0022 | A$1.4382 | 588.4049 points | 5864.0000 points |
| 28 Feb 2017 | A$0.9659 | A$1.3862 | 578.1387 points | 5712.0000 points |
| 31 Jan 2017 | A$0.9530 | A$1.3677 | 570.5421 points | 5620.0000 points |
NOTE:
ICIVF = The i Capital International Value Fund
MSCI ACWI Index: A free float-adjusted market capitalization weighted index which consists of 48 country indices, comprising 23 developed and 25 emerging market country indices.
Total % Change
| 1 Jul 2009 | 31 Dec 2017 | % Change | Compound Return | |
|---|---|---|---|---|
| ICIVF | A$1.0000 | A$1.4755 | 47.55% | 4.68% |
| MSCI ACWI | 306.1537 points | 655.9191 points | 114.25% | 9.37% |
| ASX200 | 3874.0000 points | 6065.1000 points | 56.56% | 5.41% |

| Date | ICIVF NAV (without distribution) | ICIVF NAV (with distribution) | MSCI ACWI | ASX200 |
|---|---|---|---|---|
| 31 Dec 2016 | A$ 0.9785 | A$ 1.4043 | 582.568 points | 5665.0000 points |
| 30 Nov 2016 | A$ 0.9785 | A$ 1.4043 | 559.5568 points | 5440.0000 points |
| 31 Oct 2016 | A$ 0.9460 | A$ 1.3576 | 540.1353 points | 5317.0000 points |
| 30 Sep 2016 | A$ 0.9429 | A$ 1.3532 | 546.7928 points | 5435.0000 points |
| 31 Aug 2016 | A$0.9796 | A$ 1.4059 | 554.3369 points | 5433.0000 points |
| 31 Jul 2016 | A$0.9707 | A$ 1.3931 | 547.4469 points | 5562.0000 points |
| 30 Jun 2016 | A$1.0196 (Ex-distribution NAV) | A$ 1.4059 | 536.2464 points | 5233.4000 points |
| 31 May 2016 | A$1.0587 | A$ 1.4598 | 555.697 points | 5378.6000 points |
| 30 Apr 2016 | A$1.0043 | A$ 1.3848 | 528.5206 points | 5252.2000 points |
| 31 Mar 2016 | A$1.0283 | A$ 1.4179 | 517.7195 points | 5082.8000 points |
| 28 Feb 2016 | A$1.0815 | A$ 1.4912 | 520.3528 points | 4880.9000 points |
| 31 Jan 2016 | A$1.0959 | A$ 1.5111 | 530.1727 points | 5005.5000 points |
NOTE:
ICIVF = The i Capital International Value Fund
MSCI ACWI Index: A free float-adjusted market capitalization weighted index which consists of 48 country indices, comprising 23 developed and 25 emerging market country indices.
Total % Change
| 1 Jul 2009 | 31 Dec 2016 | % Change | Compound Return | |
|---|---|---|---|---|
| ICIVF | A$1.0000 | A$1.4043 | 40.43% | 4.63% |
| MSCI ACWI | 306.1537 points | 582.5680 points | 90.29% | 8.94% |
| ASX200 | 3874.0000 points | 5665.0000 points | 46.23% | 5.19% |

| Date | ICIVF NAV (without distribution) | ICIVF NAV (with distribution) | MSCI ACWI | ASX200 |
|---|---|---|---|---|
| 31 Dec 2015 | A$1.1010 | A$1.5181 | 548.9150 points | 5295.9000 points |
| 31 Nov 2015 | A$1.1099 | A$1.5304 | 561.9603 points | 5166.5000 points |
| 31 Oct 2015 | A$1.1315 | A$1.5602 | 576.4244 points | 5239.4000 points |
| 30 Sep 2015 | A$1.1379 | A$1.5690 | 543.4672 points | 5021.6000 points |
| 31 Aug 2015 | A$1.1277 | A$1.5549 | 559.6077 points | 5207.0000 points |
| 31 July 2015 | A$1.1043 | A$1.5226 | 581.1690 points | 5699.2000 points |
| 30 Jun 2015 | A$1.0808 (Ex-distribution NAV) | A$1.4902 | 551.0148 points | 5459.0100 points |
| 31 May 2015 | A$1.1732 | A$1.5326 | 567.6590 points | 5777.1600 points |
| 30 Apr 2015 | A$1.1433 | A$1.4935 | 553.1491 points | 5789.9800 points |
| 31 Mar 2015 | A$1.1517 | A$1.5045 | 556.0039 points | 5891.5000 points |
| 29 Feb 2015 | A$1.1332 | A$1.4803 | 552.5071 points | 5928.7700 points |
| 31 Jan 2015 | A$1.1398 | A$1.4889 | 526.9062 points | 5588.3200 points |
NOTE:
ICIVF = The i Capital International Value Fund
MSCI ACWI Index: A free float-adjusted market capitalization weighted index which consists of 48 country indices, comprising 23 developed and 25 emerging market country indices.
Total % Change
| 1 Jul 2009 | 31 Dec 2015 | % Change | Compound Return | |
|---|---|---|---|---|
| ICIVF | A$1.0000 | A$1.5181 | 51.81% | 6.63% |
| MSCI ACWI | 306.1537 points | 548.9150 points | 79.29% | 9.39% |
| ASX200 | 3874.0000 points | 5295.9000 points | 36.70% | 4.92% |

| Date | ICIVF NAV (without distribution) | ICIVF NAV (with distribution) | MSCI ACWI | ASX200 |
|---|---|---|---|---|
| 31 Dec 2014 | A$1.1058 | A$1.4445 | 509.7081 points | 5411.0000 points |
| 31 Nov 2014 | A$1.0974 | A$1.4336 | 498.9131 points | 5313.0000 points |
| 31 Oct 2014 | A$1.1142 | A$1.4555 | 477.1926 points | 5526.6000 points |
| 30 Sep 2014 | A$1.1353 | A$1.4831 | 476.3720 points | 5292.8100 points |
| 31 Aug 2014 | A$1.1206 | A$1.4639 | 461.3982 points | 5625.9000 points |
| 31 July 2014 | A$1.0942 | A$1.4294 | 455.0281 points | 5632.9100 points |
| 30 Jun 2014 | A$1.1074 (Ex-distribution NAV) | A$1.4466 | 454.2520 points | 5492.5459 points |
| 31 May 2014 | A$1.1151 | A$1.3998 | 452.9214 points | 5489.0742 points |
| 30 Apr 2014 | A$1.1142 | A$1.3987 | 446.9192 points | 5394.8311 points |
| 31 Mar 2014 | A$1.1733 | A$1.4729 | 443.4587 points | 5404.8218 points |
| 29 Feb 2014 | A$1.2494 | A$1.5684 | 458.3232 points | 5190.0029 points |
| 31 Jan 2014 | A$1.2210 | A$1.5327 | 449.1924 points | 5190.0029 points |
NOTE:
ICIVF = The i Capital International Value Fund
MSCI ACWI Index: A free float-adjusted market capitalization weighted index which consists of 48 country indices, comprising 23 developed and 25 emerging market country indices.
Total % Change
| 1 Jul 2009 | 31 Dec 2014 | % Change | Compound Return | |
|---|---|---|---|---|
| ICIVF | A$1.0000 | A$1.4445 | 44.45% | 6.91% |
| MSCI ACWI | 306.1537 points | 509.7081 points | 66.49% | 9.70% |
| ASX200 | 3874.0000 points | 5411.0000 points | 39.67% | 6.26% |

| Date | ICIVF NAV (without distribution) | ICIVF NAV (with distribution) | MSCI ACWI | ASX200 |
|---|---|---|---|---|
| 31 Dec 2013 | A$1.1645 | A$1.4618 | 456.6597 points | 5352.2002 points |
| 31 Nov 2013 | A$1.1178 | A$1.4032 | 439.9479 points | 5320.0498 points |
| 31 Oct 2013 | A$1.0220 | A$1.2829 | 419.3550 points | 5420.2842 points |
| 30 Sep 2013 | A$1.0059 | A$1.2627 | 408.6085 points | 5218.8770 points |
| 31 Aug 2013 | A$0.9959 | A$1.2502 | 408.6649 points | 5134.9570 points |
| 31 July 2013 | A$1.0119 | A$1.2702 | 415.054 points | 5051.9780 points |
| 30 Jun 2013 | A$0.9593 (Ex-distribution NAV) | A$1.2042 | 388.7164 points | 4802.5908 points |
| 31 May 2013 | A$1.0068 | A$1.2275 | 382.9917 points | 4926.5688 points |
| 30 Apr 2013 | A$0.9805 | A$1.1954 | 355.8830 points | 5191.2192 points |
| 31 Mar 2013 | A$0.9915 | A$1.2088 | 345.3630 points | 4966.4990 points |
| 29 Feb 2013 | A$1.0141 | A$1.2364 | 346.2072 points | 5104.0801 points |
| 31 Jan 2013 | A$0.9702 | A$1.1829 | 340.4469 points | 4878.7808 points |
NOTE:
ICIVF = The i Capital International Value Fund
MSCI ACWI Index: A free float-adjusted market capitalization weighted index which consists of 48 country indices, comprising 23 developed and 25 emerging market country indices.
Total % Change
| 1 Jul 2009 | 31 Dec 2013 | % Change | Compound Return | |
|---|---|---|---|---|
| ICIVF | A$1.0000 | A$1.4618 | 46.18% | 8.79% |
| MSCI ACWI | 306.1537 points | 456.6597 points | 49.16% | 9.28% |
| ASX200 | 3874.0000 points | 5352.2000 points | 38.16% | 7.44% |

| Date | ICIVF NAV (without distribution) | ICIVF NAV (with distribution) | MSCI ACWI | ASX200 |
|---|---|---|---|---|
| 31 Dec 2012 | A$0.9156 | A$1.1163 | 327.2496 points | 4648.9502 points |
| 31 Nov 2012 | A$0.8573 | A$1.0452 | 318.8506 points | 4506.0361 points |
| 31 Oct 2012 | A$0.8526 | A$1.0395 | 317.3423 points | 4516.9980 points |
| 30 Sep 2012 | A$0.8483 | A$1.0343 | 318.8543 points | 4387.0181 points |
| 31 Aug 2012 | A$0.8223 | A$1.0026 | 311.7084 points | 4316.1138 points |
| 31 July 2012 | A$0.8245 | A$1.0052 | 300.304 points | 4269.1528 points |
| 30 Jun 2012 | A$0.8634 (Ex-distribution NAV) | A$1.0527 | 304.483 points | 4094.6331 points |
| 31 May 2012 | A$0.9132 | A$1.0821 | 307.2155 points | 4076.2581 points |
| 30 Apr 2012 | A$0.9622 | A$1.1401 | 315.7124 points | 4396.5781 points |
| 31 Mar 2012 | A$0.9582 | A$1.1354 | 321.7315 points | 4335.2417 points |
| 29 Feb 2012 | A$0.9263 | A$1.0976 | 307.2117 points | 4298.5488 points |
| 31 Jan 2012 | A$0.8612 | A$1.0204 | 297.9596 points | 4262.6802 points |
NOTE:
ICIVF = The i Capital International Value Fund
MSCI ACWI Index: A free float-adjusted market capitalization weighted index which consists of 48 country indices, comprising 23 developed and 25 emerging market country indices.
Total % Change
| 1 Jul 2009 | 31 Dec 2012 | % Change | Compound Return | |
|---|---|---|---|---|
| ICIVF | A$1.0000 | A$1.1163 | 11.63% | 3.19% |
| MSCI ACWI | 306.1537 points | 327.2496 points | 6.89% | 1.92% |
| ASX200 | 3874.0000 points | 4648.9500 points | 20.00% | 5.34% |

| Date | ICIVF NAV (without distribution) | ICIVF NAV (with distribution) | MSCI ACWI | ASX200 |
|---|---|---|---|---|
| 31 Dec 2011 | A$0.8430 | A$0.9989 | 292.1480 points | 4056.6001 points |
| 31 Nov 2011 | A$0.8467 | A$1.0033 | 292.4641 points | 4119.7998 points |
| 31 Oct 2011 | A$0.8583 | A$1.0170 | 292.5995 points | 4298.1001 points |
| 30 Sep 2011 | A$0.8320 | A$0.9858 | 285.7522 points | 4008.6001 points |
| 31 Aug 2011 | A$0.8699 | A$1.0307 | 290.0395 points | 4296.5000 points |
| 31 July 2011 | A$0.8838 | A$1.0472 | 305.7896 points | 4424.6001 points |
| 30 Jun 2011 | A$0.9156 (Ex-distribution NAV) | A$1.0849 | 319.2775 points | 4608.0000 points |
| 31 May 2011 | A$1.0699 | A$1.0846 | 326.4934 points | 4708.2998 points |
| 30 Apr 2011 | A$1.0762 | A$1.0910 | 326.1299 points | 4823.2002 points |
| 31 Mar 2011 | A$1.083 | A$1.0979 | 332.2930 points | 4837.8999 points |
| 29 Feb 2011 | A$1.0828 | A$1.0977 | 338.63 points | 4831.7002 points |
| 31 Jan 2011 | A$1.1222 | A$1.1376 | 336.59 points | 4753.8999 points |
NOTE:
ICIVF = The i Capital International Value Fund
MSCI ACWI Index: A free float-adjusted market capitalization weighted index which consists of 48 country indices, comprising 23 developed and 25 emerging market country indices.
Total % Change
| 1 Jul 2009 | 31 Dec 2011 | % Change | Compound Return | |
|---|---|---|---|---|
| ICIVF | A$1.0000 | A$0.9989 | -0.11% | -0.05% |
| MSCI ACWI | 306.1537 points | 292.1480 points | -4.57% | -1.85% |
| ASX200 | 3874.0000 points | 4056.6000 points | 4.71% | 1.86% |

| Date | ICIVF NAV (without distribution) | ICIVF NAV (with distribution) | MSCI ACWI | ASX200 |
|---|---|---|---|---|
| 31 Dec 2010 | A$1.0580 | A$1.0725 | 322.56 points | 4745.2002 points |
| 31 Nov 2010 | A$1.0703 | A$1.0899 | 321.55 points | 4584.3999 points |
| 31 Oct 2010 | A$1.0412 | A$1.0555 | 322.33 points | 4661.6001 points |
| 30 Sep 2010 | A$1.0002 | A$1.0139 | 315.17 points | 4582.8999 points |
| 31 Aug 2010 | A$0.9493 | A$0.9623 | 313.54 points | 4404.2002 points |
| 31 July 2010 | A$0.9548 | A$0.9679 | 320.08 points | 4493.5000 points |
| 30 Jun 2010 | A$0.9175 (Ex-distribution NAV) | A$0.9301 | 317.58 points | 4301.5000 points |
| 31 May 2010 | A$0.9201 | A$0.9201 | 330.46 points | 4429.7002 points |
| 30 Apr 2010 | A$0.9549 | A$0.9549 | 330.18 points | 4807.3999 points |
| 31 Mar 2010 | A$1.0007 | A$1.0007 | 334.92 points | 4875.5000 points |
| 29 Feb 2010 | A$0.9614 | A$0.9614 | 323.28 points | 4637.7002 points |
| 31 Jan 2010 | A$0.9581 | A$0.9581 | 332.23 points | 4569.6001 points |
NOTE:
ICIVF = The i Capital International Value Fund
MSCI ACWI Index: A free float-adjusted market capitalization weighted index which consists of 48 country indices, comprising 23 developed and 25 emerging market country indices.
Total % Change
| 1 Jul 2009 | 31 Dec 2010 | % Change | Compound Return | |
|---|---|---|---|---|
| ICIVF | A$1.0000 | A$1.0725 | 7.25% | 4.77% |
| MSCI ACWI | 306.1537 points | 322.5552 points | 5.36% | 3.54% |
| ASX200 | 3874.0000 points | 4745.2000 points | 22.49% | 14.47% |

| Date | ICIVF NAV (without distribution) | ICIVF NAV (with distribution) | MSCI ACWI | ASX200 |
|---|---|---|---|---|
| 31 Dec 2009 | A$1.0112 | A$1.0112 | 332.95 points | 4870.6001 points |
| 31 Nov 2009 | A$0.9962 | A$0.9962 | 320.83 points | 4701.2998 points |
| 31 Oct 2009 | A$0.9850 | A$0.9850 | 312.73 points | 4643.2002 points |
| 30 Sep 2009 | A$0.9931 | A$0.9931 | 325.46 points | 4743.6001 points |
| 31 Aug 2009 | A$0.9858 | A$0.9858 | 326.31 points | 4479.1001 points |
| 31 July 2009 | A$1.006 | A$1.0061 | 320.13 points | 4244.0000 points |
NOTE:
ICIVF = The i Capital International Value Fund
MSCI ACWI Index: A free float-adjusted market capitalization weighted index which consists of 48 country indices, comprising 23 developed and 25 emerging market country indices.
Total % Change
| 1 Jul 2009 | 31 Dec 2009 | % Change | Compound Return | |
|---|---|---|---|---|
| ICIVF | A$1.0000 | A$1.0112 | 1.12% | N/A |
| MSCI ACWI | 306.1537 points | 332.9470 points | 8.75% | N/A |
| ASX200 | 3874.0000 points | 4870.6000 points | 25.73% | N/A |
